From Orbit to Insight
How we turn invisible thermal signals into actionable management summaries.
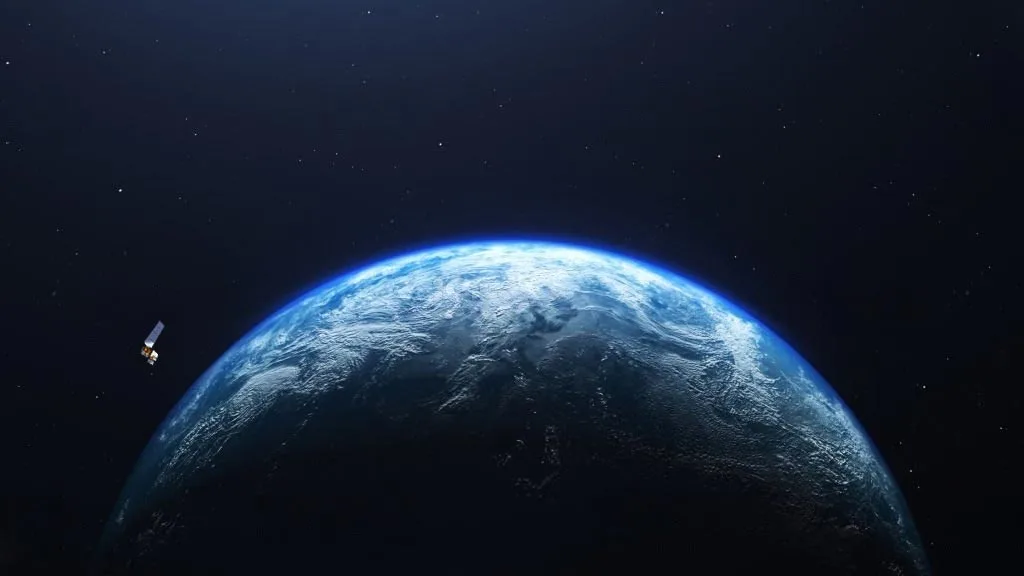
LaGrand uses advanced satellite data to provide a real-time view of energy networks and production activities at sites around the world. With our unique, patented algorithm, we can see through cloud cover to deliver reliable, up-to-date business intelligence that enables you to take informed decisions.
The Data Pipeline
Monitoring energy through thermal emissions
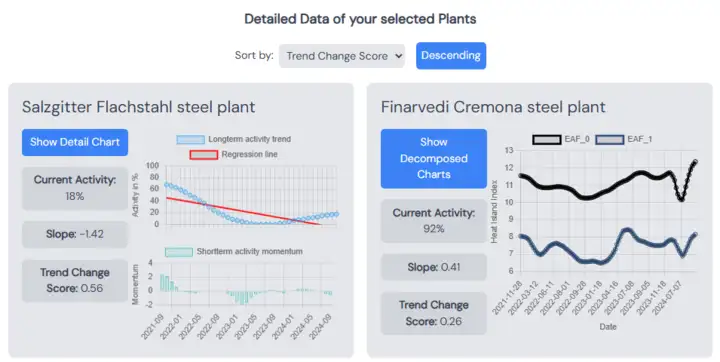
Energy sources can be observed through changes in thermal emissions over time. By monitoring this data, we can infer the health of your network, the level of production, energy usage, leakages, and other key indicators. Our radiation emission analysis delivers detailed insights into the dynamics of your activity area.
Precise segmentation & mapping
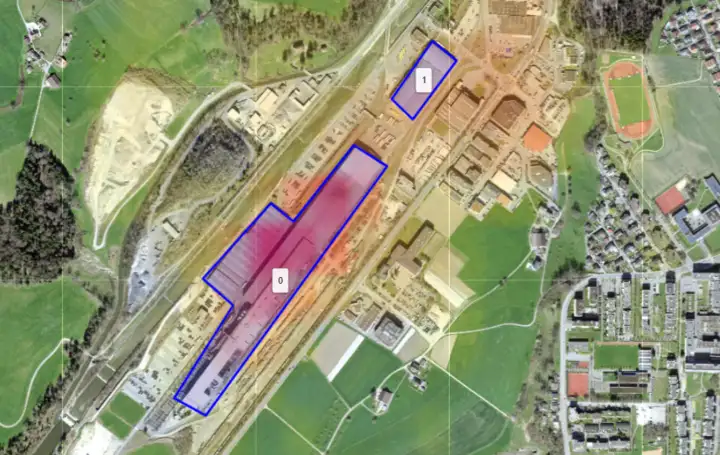
We analyze shape features of buildings and heat sources to segment them into meaningful activity zones. Our machine learning model enhances raw satellite resolution from 10 meters to 2.5 meters, allowing us to detect irregularities early before disruptions occur.
Data fusion
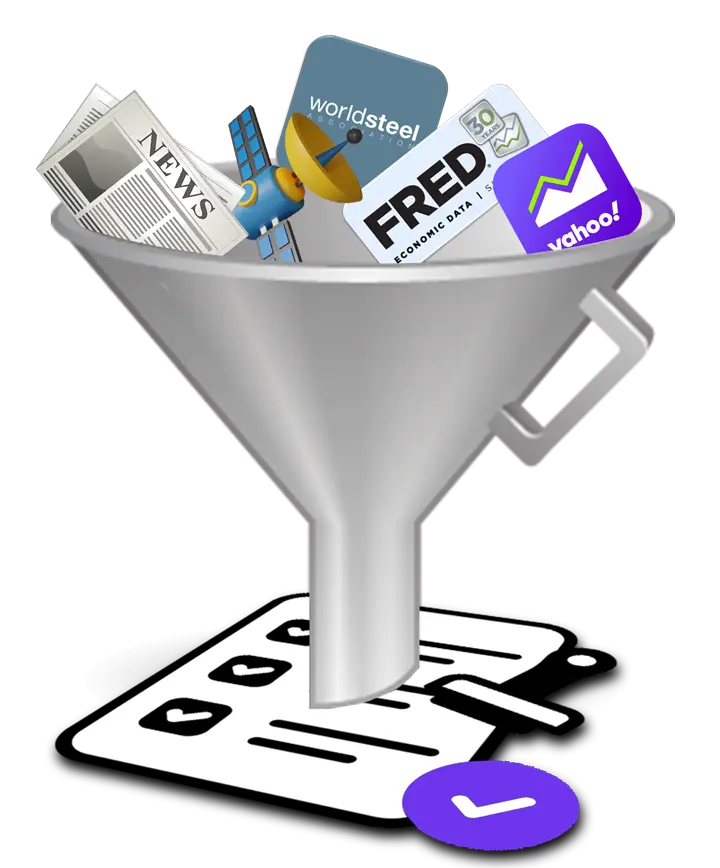
We combine customer datasets (like GIS network plans and damage history) with weather data and satellite thermal scans. Using Large Language Models (LLMs), we translate this complex sea of information into clear, actionable management summaries.
Patented Cloud Reconstruction
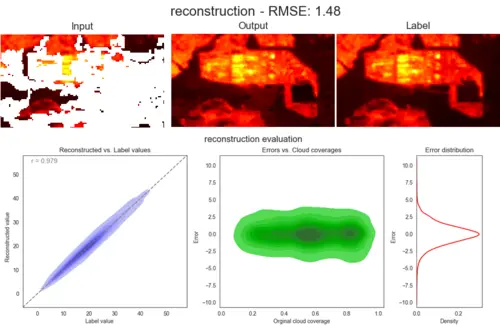
One of the biggest challenges in satellite-based energy monitoring is cloud cover. Our patented algorithm (Patent WO/2026/037483) solves this by identifying masked (cloud-covered) regions, defining a geographical offset area, and selecting a complementary scaled historical patch from our multi-source dataset to replace the missing data points.
This process ensures an uninterrupted weekly data flow and stable inputs for our AI anomaly detection model, even during sub-optimal weather.
Read Patent Specification → European Space Agency
 NASA
NASATechnical Specifications
6-Day Update Cycle
New satellite data is collected every six days per location, allowing for continuous and steady monitoring of your assets.
Cloud Reconstruction
Patented algorithms reconstruct obscured areas under cloud cover to deliver uninterrupted data, even in bad weather.
No Integration Required
Seamless web app access. No software installation or invasive integration into your company’s internal network needed.
Historical Depth
Assess trends and track changes over time with complete historical observations dating back to 2017.