Save on Procurement by Monitoring Your Producers

Overcoming Industrial Supply Chain Challenges

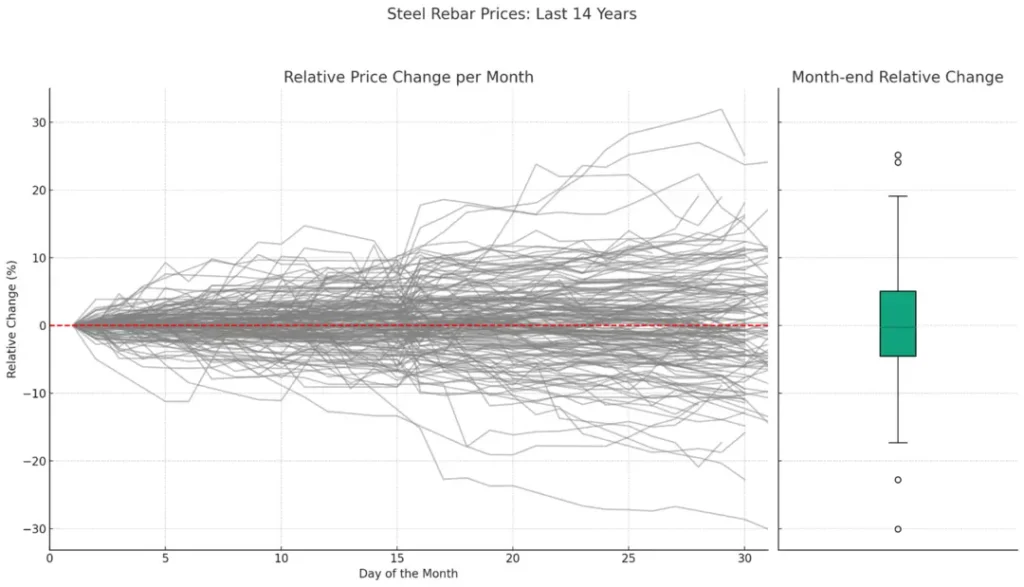
Graph showing the monthly price volatility of steel rebar over 14 years with a box plot of month-end relative changes
Analysis of steel rebar price changes over the last 14 years reveals that monthly price variations consistently average a 6% difference between the start and end of the month.

Struggling with Price Volatility?

As a Procurement Manager, you know that e.g. steel prices can fluctuate by up to 6% per month. This volatility leads to:

Budgeting Difficulties

Predicting costs becomes nearly impossible, making financial planning a complex task.

Non-Ideal Contract Forms

Finding the right contract in a volatile market is tough. Long-term fixed-price contracts may seem secure but can lead to overpaying when prices drop. On the other hand, overly flexible contracts may not provide the stability needed for budgeting and supplier commitments.

Struggling with Price Volatility?

Graph showing the monthly price volatility of steel rebar over 14 years with a box plot of month-end relative changes
Analysis of steel rebar price changes over the last 14 years reveals that monthly price variations consistently average a 6% difference between the start and end of the month.

As a Procurement Manager, you know that e.g. steel prices can fluctuate by up to 6% per month. This volatility leads to:

Budgeting Difficulties

Predicting costs becomes nearly impossible, making financial planning a complex task.

Non-Ideal Contract Forms

Finding the right contract in a volatile market is tough. Long-term fixed-price contracts may seem secure but can lead to overpaying when prices drop. On the other hand, overly flexible contracts may not provide the stability needed for budgeting and supplier commitments.
Facing Market Transparency Issues?

Limited insight into producers’ capacity and workload affects your negotiation power:

Producers Hold the Cards

When producers claim full capacity, they dictate terms, making it hard for you to secure favorable pricing or terms.

Unclear Market Dynamics

Without accurate data, understanding the market is like navigating in the dark.

It's Beneficial to Measure Your Suppliers Activites

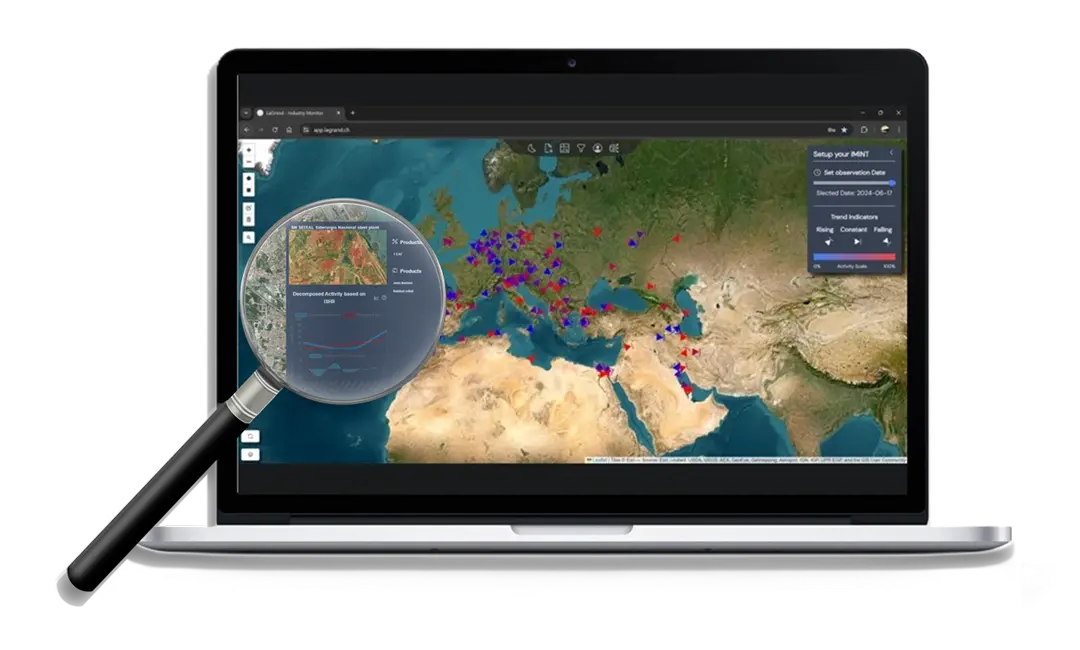
A laptop screen displaying the LaGrand web application map, showing industrial activity across Europe, the Middle East, and North Africa. A magnifying glass zooms in on a single steel plant in Germany, providing detailed decomposed activity data based on thermal analysis.
Global market transparency at your fingertips: Blue and red markers indicate activity levels at industrial sites worldwide, with a zoom-in function offering detailed insights into the production trends of each facility.

Satellites Take Weekly Measurements
for Any Target You Specify

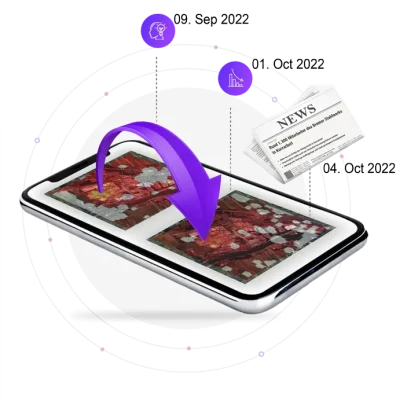
A tablet displaying thermal satellite imagery of an industrial area, with a large purple arrow emphasizing the analysis process. Surrounding icons represent AI-driven insights, production analytics, and news data integration. A newspaper headline mentions the closure of a steel plant in Bremen.
Using satellite data, we detected the shutdown of a steel plant before it was reported in the media—providing a critical edge over traditional market insights.

Tired of Outdated Market Reports?

Relying on reports like the Purchasing Managers’ Index or industry articles can be problematic:

Subjective Insights

These reports are often based on interviews and opinions, not actually measured data.

Delayed Information

  • By the time you read these reports, every market participant is already informed and likely planning similar actions as you.

Satellites Take Weekly Measurements
for Any Target You Specify

A tablet displaying thermal satellite imagery of an industrial area, with a large purple arrow emphasizing the analysis process. Surrounding icons represent AI-driven insights, production analytics, and news data integration. A newspaper headline mentions the closure of a steel plant in Bremen.
Using satellite data, we detected the shutdown of a steel plant before it was reported in the media—providing a critical edge over traditional market insights.

Our Real-Time Solution for Procurement Managers

Unlock the power of Real-Time Satellite Data to gain precise insights into the production capacity and utilization of steel plants. With our solution, you can:

Gain Market Transparency
Understand producer workloads to strengthen your negotiation position.

Choose the Best Contract Types
Select contract types and durations that align with current market conditions and future outlooks.

Optimize Supplier Selection
Identify which suppliers have available capacity and can meet your needs.

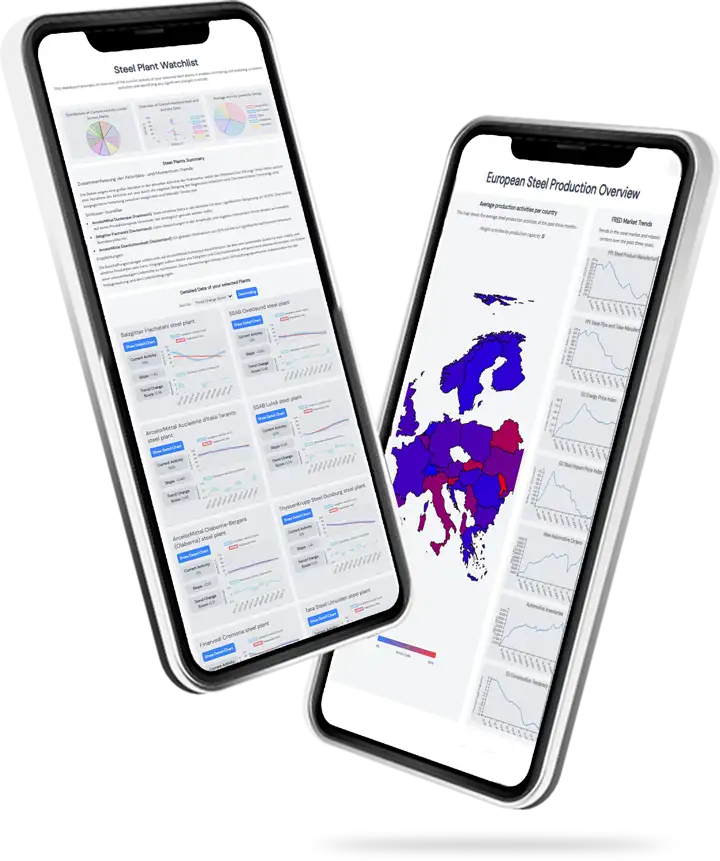
Two smartphones displaying insights from the LaGrand web application. One screen shows a Steel Plant Watchlist with activity trends, and the other displays a European Steel Production Overview with a heat map and market trends.

Our Real-Time Solution for Procurement Managers

Unlock the power of Real-Time Satellite Data to gain precise insights into the production capacity and utilization of steel plants. With our solution, you can:

Two smartphones displaying insights from the LaGrand web application. One screen shows a Steel Plant Watchlist with activity trends, and the other displays a European Steel Production Overview with a heat map and market trends.

Gain Market Transparency
Understand producer workloads to strengthen your negotiation position.

Choose the Best Contract Types
Select contract types and durations that align with current market conditions and future outlooks.

Optimize Supplier Selection
Identify which suppliers have available capacity and can meet your needs.

Ready to Transform Your Procurement Strategy?

Don't let uncertainty hold you back. Contact us Today for a free consultation and see our solution in action.