How Our Solution Works
Say Goodbye to Guessing, Start Progressing with Real-Time Assessing
Relying on subjective or outdated information can lead to costly mistakes. What if you could have real-time economic meaurements at your fingertips, eliminating uncertainty and helping you make smarter decisions?
Our solution gives you a clear, up-to-date view of any industrial activity and transfors complex data into actionable insights.
Gain Market Transparency
Understand producer workloads to improve your decision making.
Enhance Risk Management
Identify disruptions early and act quickly to avoid losses.
Global Coverage
Access real-time production data from industrial sites worldwide.
Ready to see how it works?
Let’s dive into the technology behind these game-changing insights.
Ready to see how it works?
Let’s dive into the technology behind these game-changing insights.
HOW WE PROVIDE ECONOMIC DATA
Data Collection Using Satellites
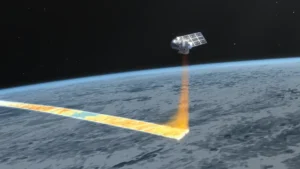
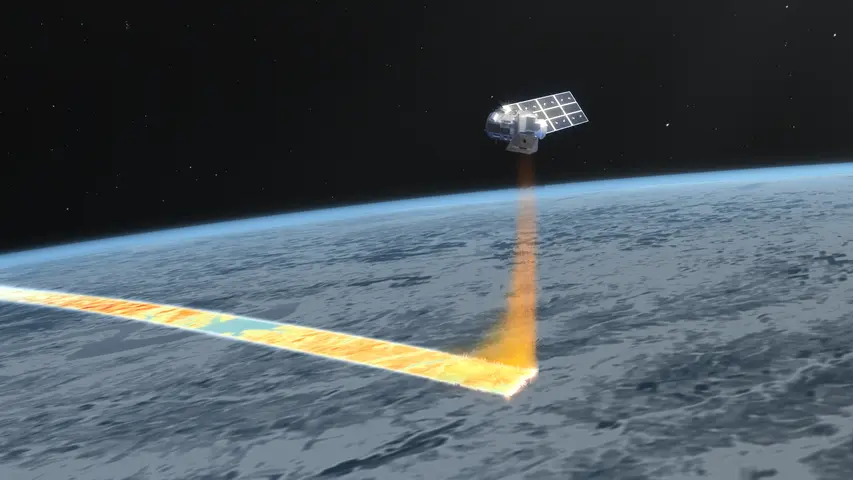
Satellite capturing thermal infrared data for real-time Earth monitoring.
We use cutting-edge satellite technology to capture economic activity data from industrial areas worldwide. By leveraging multiple satellite missions, we ensure consistent, high-quality data, providing you with a clear view of industrial dynamics.
Every six days per location, new data is collected, enabling real-time insights into changes in production, energy consumption, and more.
Hidden Insights Due To Cloud Reconstruction
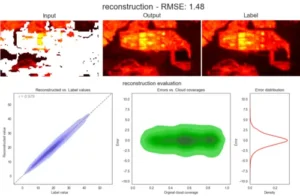
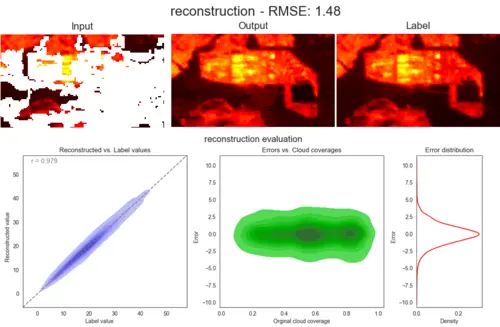
One of the biggest challenges in satellite data is cloud cover, which can obscure critical information. We’ve solved this problem with our patented cloud reconstruction algorithm, designed to fill in the gaps left by cloud cover. This means you can still rely on our data, even when the skies aren’t clear.
With this breakthrough technology, we ensure that valuable insights are never lost, offering you uninterrupted data flow for better decision-making.
Precision Segmentation of Industrial Areas
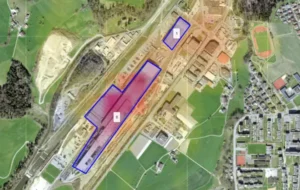
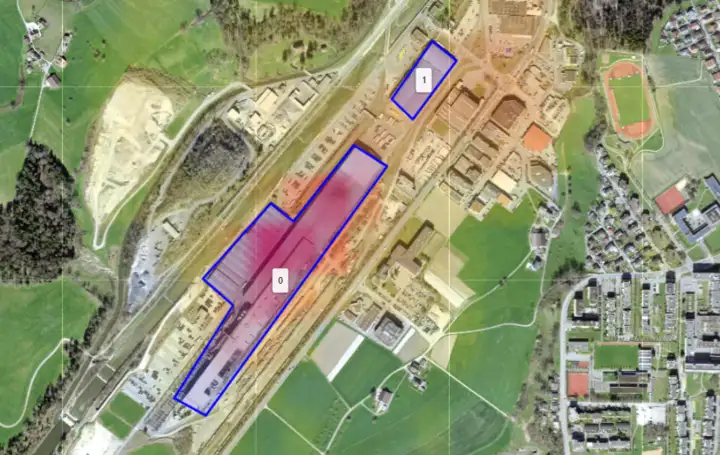
Our solution goes beyond just collecting data—it analyzes the shapes of buildings and heat sources within industrial areas to segment them into meaningful zones. This granular approach allows us to detect irregularities early, helping you take proactive steps to avoid disruptions.
With our segmentation technology, you can see exactly what’s happening in each part of an industrial facility, gaining unparalleled visibility into the heart of production.
Tracking Economic Activity Through Thermal Emissions
Economic activity can be observed through changes in thermal emissions over time. By monitoring this data, we can infer the level of production, energy usage, and other key factors that indicate how well an industrial area is performing.
Our radiation emission analysis delivers detailed insights into the dynamics of industrial processes, helping you understand shifts in production and economic health.
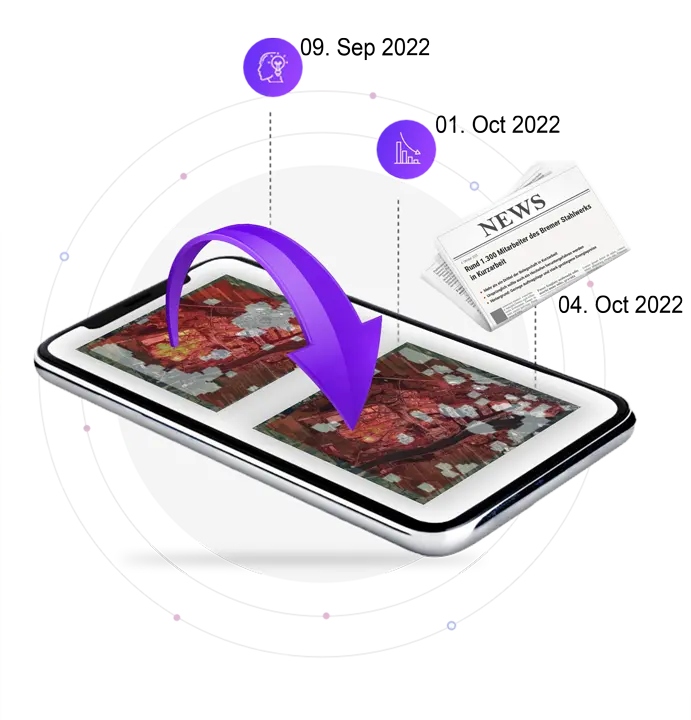
AI-Powered Production Mapping and Anomaly Detection
To make this data even more actionable, we integrate AI that maps activities to production in metric tons. This allows us to calculate the exact output of an industrial area based on observed activities. But it doesn’t stop there—our AI also detects anomalies early, sending you real-time alerts when something changes in your watchlist.
With our AI integration, you stay informed and can act swiftly when unexpected events occur, ensuring you’re always one step ahead.
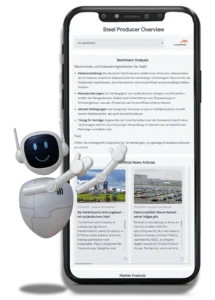
LLM Integration: Turning Data into Actionable Insights
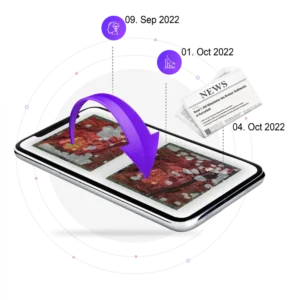
We’ve taken our solution a step further by integrating LLMs (Large Language Models) to compare our real-economy data with publicly available sources, like news articles, FRED data, and financial information. This advanced analysis translates a sea of raw data into a management summary that highlights actionable insights.
By connecting your data with global economic signals, you’re equipped to make data-driven decisions that improve your strategy and strengthen your competitive edge.
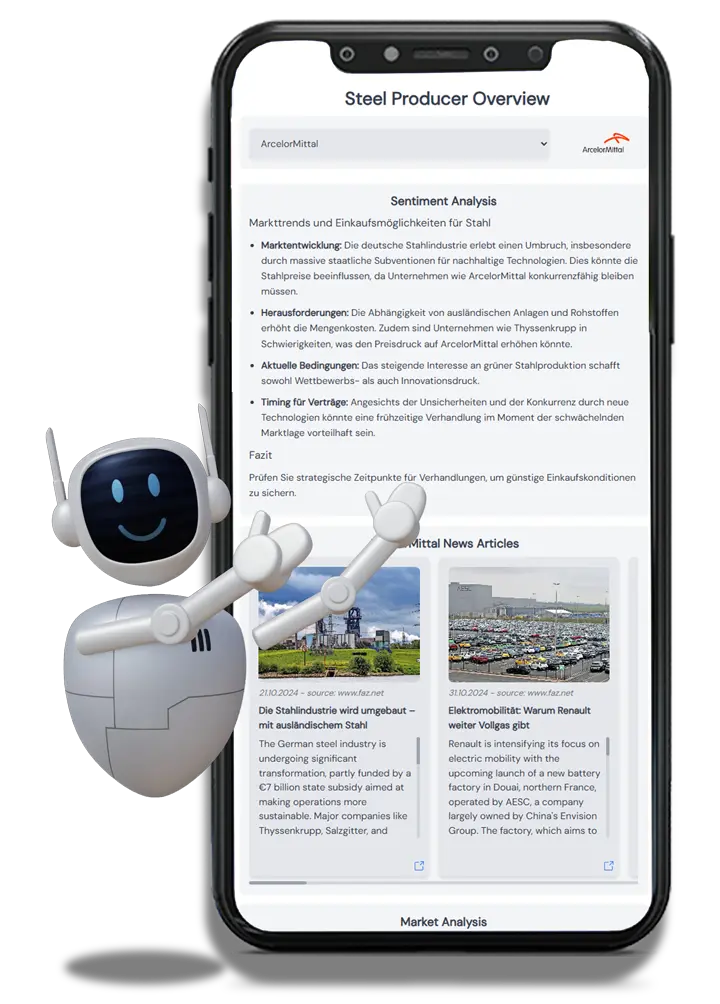

Cross-Validation with Trusted Sources
To ensure accuracy, we use cross-validation techniques that compare our findings with reputable sources, like the reports from the World Steel Association. This guarantees that the insights you receive are not only timely but also trustworthy.
Our cross-validation process adds an extra layer of confidence to your decision-making, combining cutting-edge technology with established industry benchmarks.
HOW WE PROVIDE ECONOMIC DATA
Data Collection Using Satellites
We use cutting-edge satellite technology to capture economic activity data from industrial areas worldwide. By leveraging multiple satellite missions, we ensure consistent, high-quality data, providing you with a clear view of industrial dynamics.
Every six days per location, new data is collected, enabling real-time insights into changes in production, energy consumption, and more.
Hidden Insights Due To Cloud Reconstruction
One of the biggest challenges in satellite data is cloud cover, which can obscure critical information. We’ve solved this problem with our patented cloud reconstruction algorithm, designed to fill in the gaps left by cloud cover. This means you can still rely on our data, even when the skies aren’t clear.
With this breakthrough technology, we ensure that valuable insights are never lost, offering you uninterrupted data flow for better decision-making.
Precision Segmentation of Industrial Areas
Our solution goes beyond just collecting data—it analyzes the shapes of buildings and heat sources within industrial areas to segment them into meaningful zones. This granular approach allows us to detect irregularities early, helping you take proactive steps to avoid disruptions.
With our segmentation technology, you can see exactly what’s happening in each part of an industrial facility, gaining unparalleled visibility into the heart of production.
Tracking Economic Activity Through Thermal Emissions
Economic activity can be observed through changes in thermal emissions over time. By monitoring this data, we can infer the level of production, energy usage, and other key factors that indicate how well an industrial area is performing.
Our radiation emission analysis delivers detailed insights into the dynamics of industrial processes, helping you understand shifts in production and economic health.
AI-Powered Production Mapping and Anomaly Detection
To make this data even more actionable, we integrate AI that maps activities to production in metric tons. This allows us to calculate the exact output of an industrial area based on observed activities. But it doesn’t stop there—our AI also detects anomalies early, sending you real-time alerts when something changes in your watchlist.
With our AI integration, you stay informed and can act swiftly when unexpected events occur, ensuring you’re always one step ahead.
LLM Integration: Turning Data into Actionable Insights
We’ve taken our solution a step further by integrating LLMs (Large Language Models) to compare our real-economy data with publicly available sources, like news articles, FRED data, and financial information. This advanced analysis translates a sea of raw data into a management summary that highlights actionable insights.
By connecting your data with global economic signals, you’re equipped to make data-driven decisions that improve your strategy and strengthen your competitive edge.
Cross-Validation with Trusted Sources
To ensure accuracy, we use cross-validation techniques that compare our findings with reputable sources, like the reports from the World Steel Association. This guarantees that the insights you receive are not only timely but also trustworthy.
Our cross-validation process adds an extra layer of confidence to your decision-making, combining cutting-edge technology with established industry benchmarks.
Ready to be well informed in Real Time?
Whether you’re a Procurement Manager, Credit Risk Officer, or working for a Government, the power of real-time insights is now at your fingertips. Don’t let subjective and outdated information hold you back any longer.
See the Future of Reporting Today
Experience how AI-driven reporting transforms the way you understand and act on complex information.
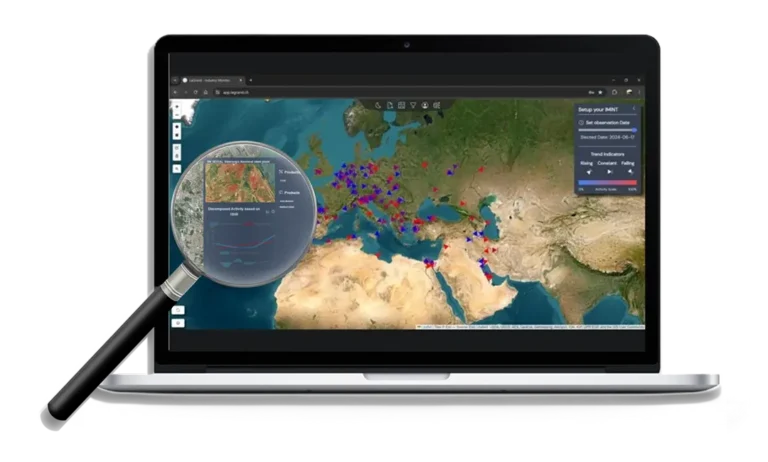
Take control today
Contact us Today for a free consultation and see see how our solution can transform the way you take action.


